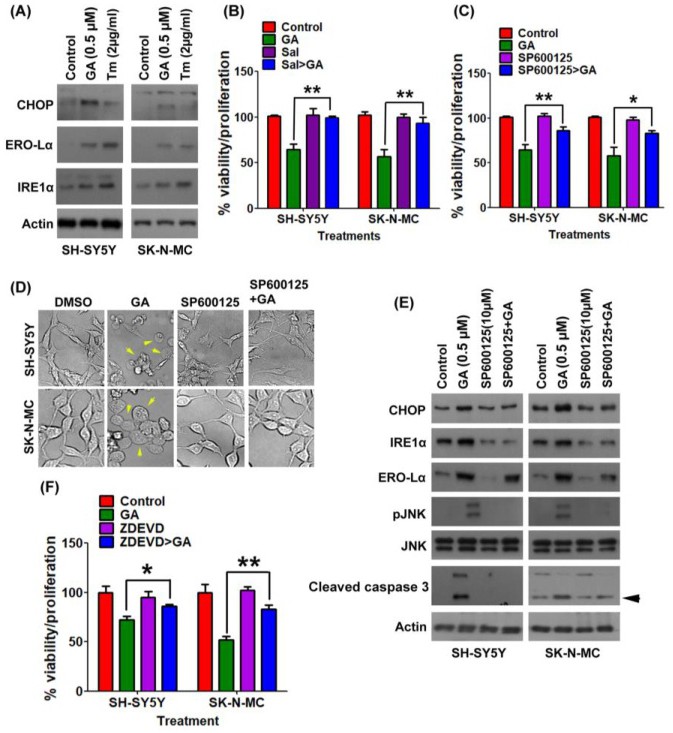
Fig. 3. Gambogic acid activates JNK and ER stress to induce cell death. (A) SH-SY5Y and SK-N-MC cells were treated with ER stress inducer Tm for 24 h or with GA for 6 h and expressions of ER stress-related proteins (CHOP, ERO, and IRE) were evaluated using Western blot. (B) SH-SY5Y and SK-N-MC cells were pretreated with ER stress inhibitor, Sal, for 24 h and then with GA for 6 h. Cell viability/proliferation assay was performed and the relative percentages of viability with proliferation were calculated and plotted as a histogram using GraphPad Prism 5. (C-E) Neuroblastoma cells were treated with JNK inhibitor- SP600125 incubated for 24 h and GA-treated cells were incubated for 6h. In the combination treatment sets, cells were first exposed to SP600125 for 24 h and then GA was added for 6 h. (C) Cell viability/proliferation assay was performed and the relative percentages of viability with proliferation were calculated and plotted as a histogram by using GraphPad Prism 5. (D) Cellular morphology was imaged at 40X after the treatment period. Yellow arrows are indicative of the apoptotic cells. (E) Expression of different ER stress and apoptosis-related proteins were examined with Western blot. Actin was used as a loading control. (F) Cells were pretreated with pan-caspase inhibitor Z-DEVD-FMK and then with GA to find the involvement of caspase dependence in the GA-death pathway. Cell viability/proliferation assay was performed and the relative percentages of viability with proliferation were calculated and plotted as a histogram by using GraphPad Prism 5.